In the days past we could pick the fixture based solely on appearance and wattage, since all the sources were incandescent. There was a period where fluorescent lamps started to be used, but anyone who wanted full dimming, rejected the fluorescent lamp as unacceptable. They also didn’t have good color rendering in the beginning.
Now we are leaving behind both, in favor of the LED chip. In a recent Buyers Guide (PLSN, Aug. 2019, pages 56-57), there were house lights from 14 manufacturers being shown. If you went to the trade show, Lightfair, the show for the Architectural Lighting industry, the floor was filled with all sizes and varieties of LED light sources. So how do you know which one will work for your project? Can you use the same metrics that have been used for an Incandescent source? The answer is no.
Short List of Metrics to Compare:
- L70 — End of Life
- Cooling System
- Lumens
- Color Rendering — using TM-30 not IES CRI
- Color Temperature of White
- LED Colors
- Dimming and Flicker
L70 — End of Life
The first metric to look at is end of life.
When an incandescent lamp fails, that is it. One second you can see output, and the next moment 0 output. The same cannot be said of the LED. There are two standards and one rating you need to know about to understand how to evaluate end of “useful,” since even at that point the LED’s will still be providing output. Here are the document titles.
ANSI/IES LM-80-15 — Approved Method: Measuring Luminous Flux and Color Maintenance of LED Packages, Arrays and Modules.
Since we can’t wait for 100,000 hours for the results, this standard describes how to setup and run the tests.
IES TM-21-11 — Projecting Long Term Lumen Maintenance of LED Light Sources
This TM (Technical Memorandum) provides a method of taking the data from LM-80-15 and providing a number for Lumen Maintenance.
Lp Lumen Maintenance Value — Where P is the percentage value of the initial output that is considered the end of life.
While it is nice to know about LM-80-15, and TM-21-11, unless you are working in a testing lab, you only need to worry about the L value. The standard percentage people work with is 70 percent. This means that the output of the source is 70 percent of when it was first installed. There are two things that can change as the LED module ages. One is the output; the second is that the color can shift towards green and yellow.
Cooling System
There are two conditions that affect LED life. The first is heat. While it is true the LED’s we use do not produce heat in the form of Infrared light, at the diode junction, there is a significant amount of heat. This heat, if not kept in check, will cause premature death of the LED. Therefore, LED fixtures are heavier than you first thought they should be. They include large heat sinks to dissipate the heat. If the fixture is light weight, then you are going to hear a fan running to compensate for the lack of enough heat sink.
The first thing to find out is how they are dissipating the heat and how close to the upper operating temperature recommended by the manufacturer they are running the LED’s. With this information you can make a more informed decision. Also ask how the L70 was determined, it can be reported, which uses six times the hours in the LM-80. The other option is that it can be calculated using the LM-80 data.
The other factor that will affect the L70 rating is how much power you are using to drive the LED’s. The more power you use the brighter they are, up to a point. The life span goes down the harder you drive them. There are sweet spots where the right temperature and power meet to extend the life of the LED’s. This is represented by the L70 value.
The only thing to add to the cooling system is that a convection cooling method will make the acoustician very happy, a plus when you must tell him about all the movers you are installing.
Lumens
Lumen output is a good start to deciding if the fixture will work in the space, but what does it really mean? The first question to ask is, when was the reading taken? When you first turn on the fixture you will get more output. A better reading is referred to as “hot” lumens. Hot lumens readings are taken after the fixture has had time to warm up to full operating temperatures and stabilized. This reading will be lower, but realistic to normal operation.
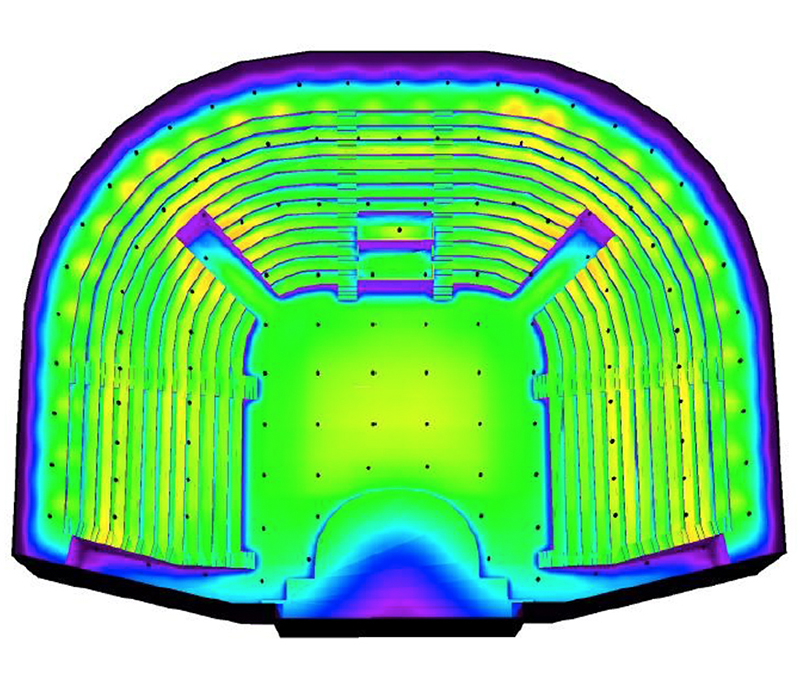
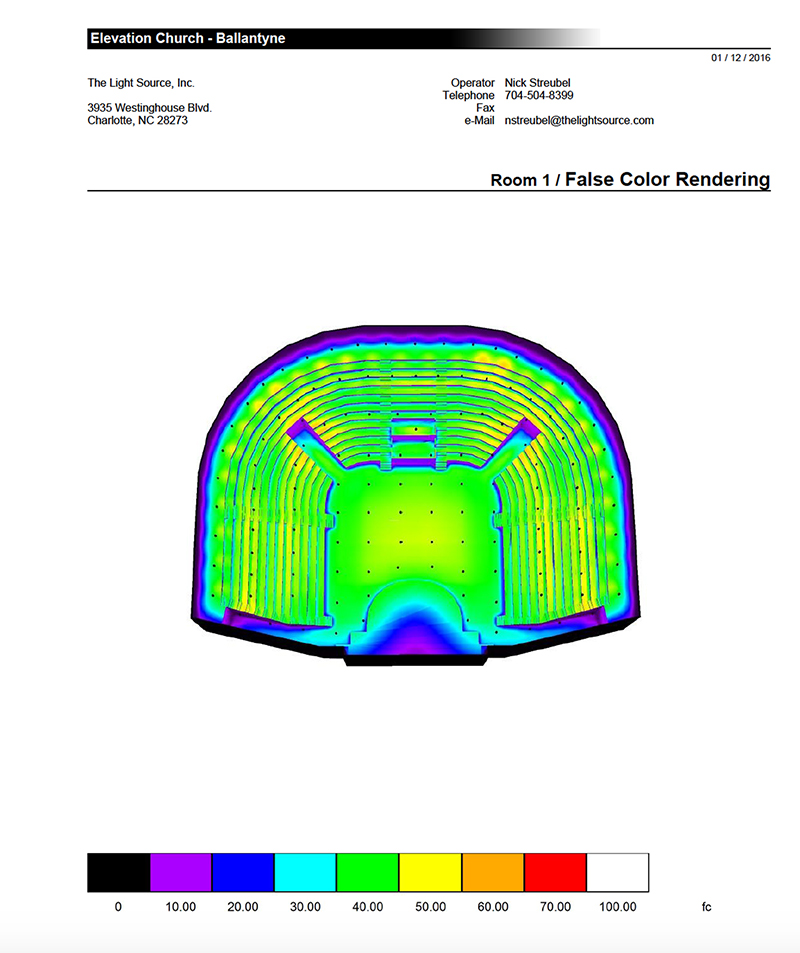
The next thing to look at with lumens is how that translates to actual light at the floor. The best way to find this out is to use a photometric program that takes the IES file and uses that in a 3D representation of the room to calculate the footcandles. (See Fig. 1). Let’s break that down and start with the IES file. Simply put, the fixture in question is tested by an independent lab and data is provided based on the standard TM-27-14 “IES Standard Format for the Electronic Transfer of Spectral Data”. IES is the Illuminating Engineering Society and is like ESTA in that one of their mandates is to maintain the standards for the industry.
There are several programs available to run photometric studies. You build the room in 3D, then place fixtures in the room. The fixtures are chosen by the IES file. The information in the IES file is specific to not just the lumen output but the beam spread as well. For this reason, you will get better information than if you see different fixtures in a shootout with different beam spreads. The other issue with a shootout is that you are looking at a single fixture, while most designs are use several fixtures over a large area. A typical house light design is based around even coverage with minimal to no shadows. In order to achieve this design, it is better to use a wide beam spread. When you see a demonstration of one fixture at 20 feet in a wide beam spread it is not very impressive. The photometric report will take into account all the fixtures so that you can ensure you are using enough fixtures to achieve the desired footcandles.
Color Rendering
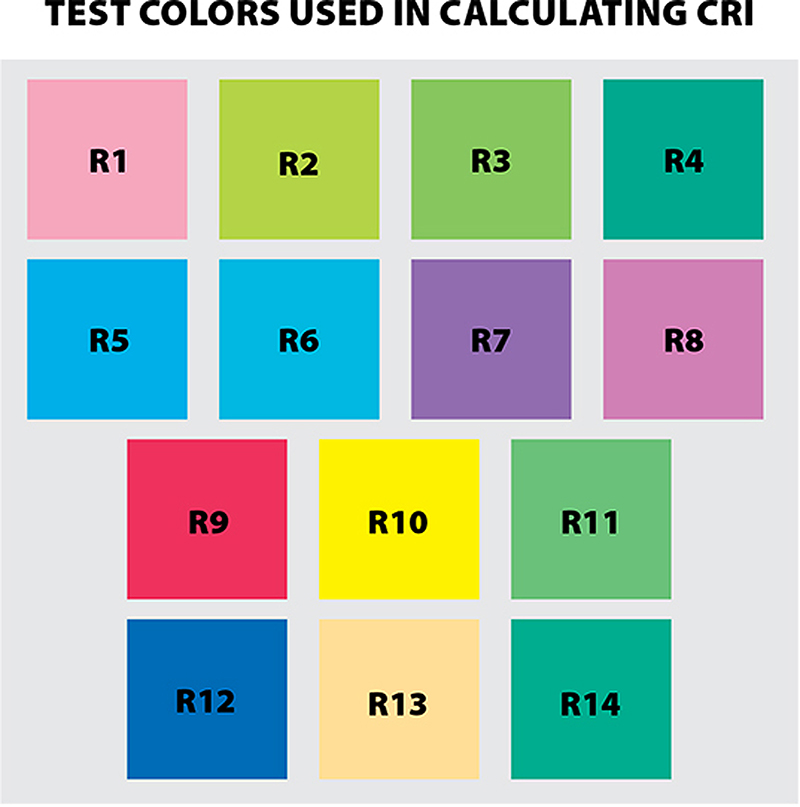
Color rendering measurement is in a state of flux right now because people will say they want a CRI of >80, but what they really should say is that they are using the CIE Test-Color Method. (See Fig. 2). The CIE method was first introduced in 1965, and last revised in 1995. This method was first developed using eight color samples that were used to compare the tested source against a reference source based on blackbody radiation. they later added eight more colors. The new method that was introduced in 2015 is TM-30-18 IES Method for Evaluating Light Source Color Rendition. There are several changes in this method. One to note is that they use 99 samples, which cover more of the color space. Another is that CIE provides two metrics, while LM-30 provides eight. (See Fig. 3).
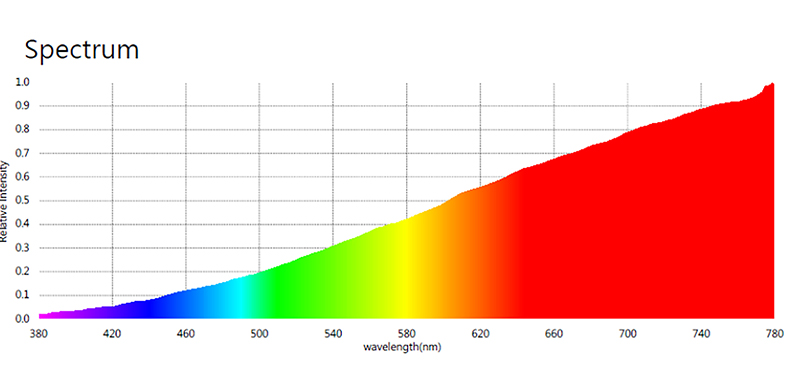
Why does this matter now in evaluating a fixture? A low CRI can mislead you in understanding the light. LED’s have a different spectral distribution than an incandescent lamp. An incandescent graph starts low in the blue range and ends high in the red. Remember how many fixtures you need to get enough Congo Blue on stage. If you look at a spectral distribution for a white LED; it is not a nice sweeping curve but has peaks and valleys, and typically is low on the deep red.
If I have a white LED along with other colors in a fixture, then I can actually hit any CRI I want by playing with the colors and adding them to the white. In conclusion I would encourage you to ask for the TM-30 data in addition to the CRI data.
Color Temperature of White
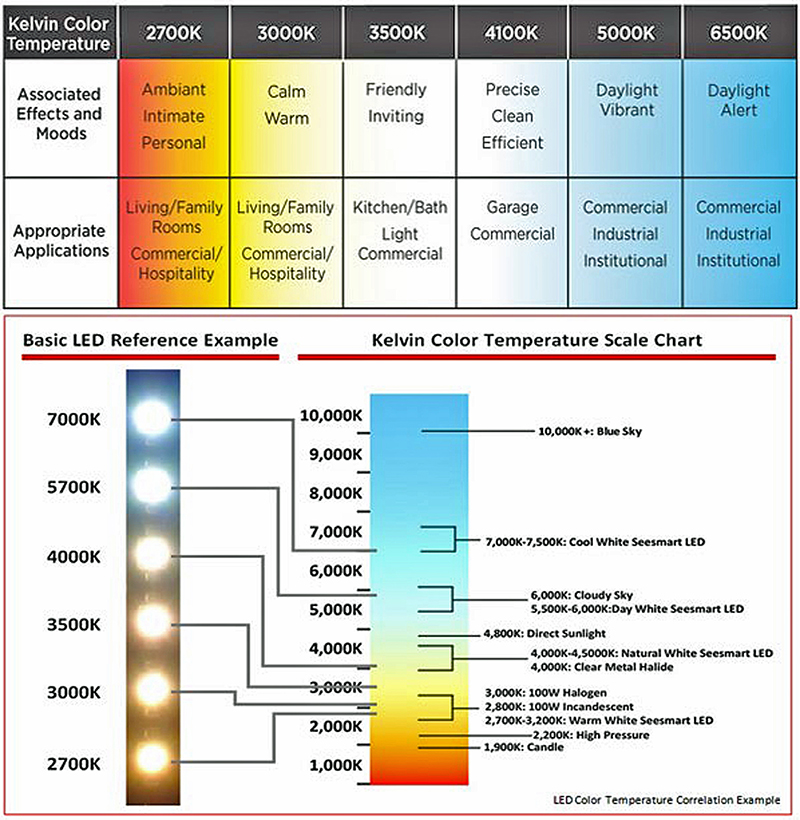
Remember that the Color Rendering only applies to white light, which leads to the term Correlated Color Temperature, or CCT. (See Fig. 4). CCT relates to how warm or cool the light appears. There is no right answer to the question what color temperature we should get. You must factor in a number of things to answer that question, starting with what color is the room, walls, carpet, and chairs? Are you using video, and what color temperature is the stage lighting? Are you doing audience shots? Are there windows?
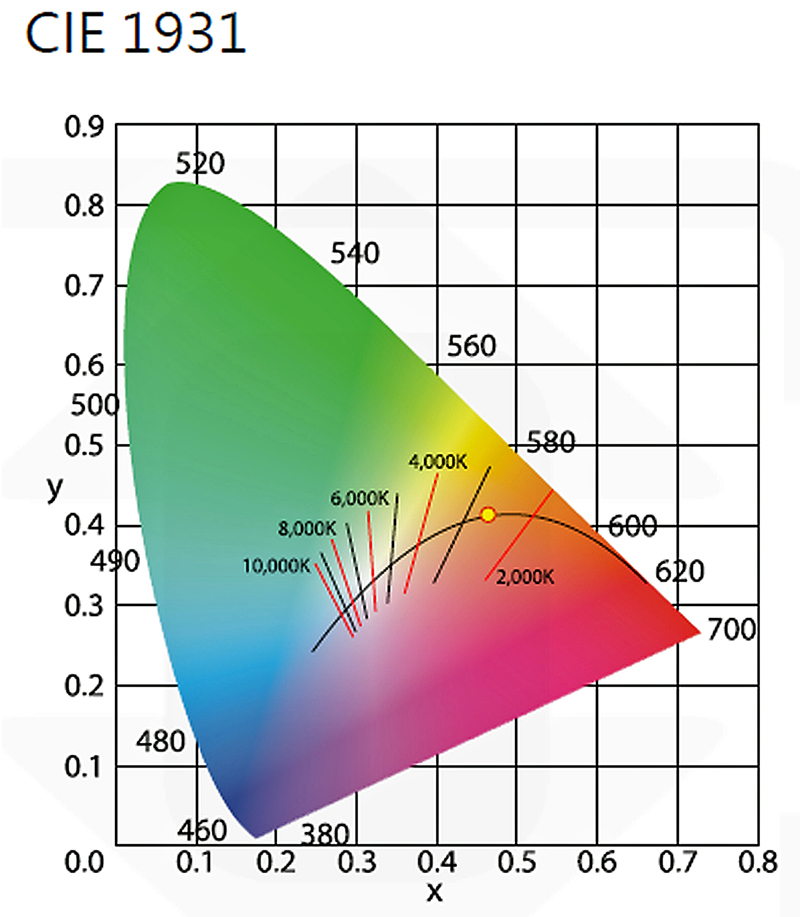
Another thought would be, can the fixture provide different color temperatures, or is it a fixed value? Part of the color temperature metric is the DUV value. When you look at a color gamut chart that shows the Planckian curve, you will see lines that cross the curve denoting a color temperature. A specific color temperature value is represented anywhere along that crossing line. The DUV value tells you how close to the curve the light source is, so while a source might be 3000 K it can also be a minus value which will give the light a purplish hue. (See Fig. 5).
LED Colors
Tuning the color temperature requires more than one color of LED. Some fixtures have no white LED’s and mix to white; others have white only and no color mixing. In this time when the fixtures will last at least five years, possibly more if they aren’t used very much, remember the L70 is hours not years, if they only are used a few hours each day, they could last 10 years or more. With the cost of the fixture, and installation look down the road to see if color might be in your future.
Dimming and Flicker
The last metric in our list is dimming and flicker. Starting with flicker, and not to the human eye, if you can see it visually that fixture shouldn’t even be considered. When LED’s were first introduced video flicker was not really an issue since they were not being used on the big shows but in the night club realm. Now most new spaces are being designed with LED’s exclusively so not flickering on video is important. I have not heard of any reputable manufacturer that has the problem, but you should be aware of it when you test the fixture, your phone can usually provide a good enough test of this.
House lights must be able to dim all the way to zero in a curve that matches the incandescent fixtures. Beware the offer of dimming to one percent; there will be a noticeable change both down and up. The other control to watch out for is 0-to-10-volt control. First, they do not give you individual control but rather groups. Second, they do not go to zero without a sudden visible change.
Dimming with DMX can appear as smooth as incandescent. All of the companies in the Buyers guide understand how to do it. However, you may not be involved in the decision. The electrical Engineer could be making the choice, or the Electrical Contractor wants to substitute, or the Contractor needs to save money. When that happens, they will look to the architectural fixtures. That is when you have to require proof of all the metrics.
Matching the Venue
Does your space have a flat ceiling and a flat floor? Those spaces are easy to pick the right fixture for, since they are all the same. Most theaters are not built that way, they have raked seating and a flat ceiling so the distance from fixture to seat changes. They could have a balcony with three different heights within the space and different installation requirements. Make sure that you pick a single manufacturing source for all of the fixtures so that you have continuity across the project.
Stephen Ellison handles technical sales and project management duties for The Light Source, www.thelightsource.com.


